nf-core/scnanoseq

















Introduction
nf-core/scnanoseq is a bioinformatics best-practice analysis pipeline for 10X Genomics single-cell/nuclei RNA-seq data derived from Oxford Nanopore Q20+ chemistry (R10.4 flow cells (>Q20)). Due to the expectation of >Q20 quality, the input data for the pipeline does not depend on Illumina paired data. Please note scnanoseq can also process Oxford data with older chemistry, but we encourage usage of the Q20+ chemistry when possible.
The pipeline is built using Nextflow, a workflow tool to run tasks across multiple compute infrastructures in a very portable manner. It uses Docker/Singularity containers making installation trivial and results highly reproducible. The Nextflow DSL2 implementation of this pipeline uses one container per process which makes it much easier to maintain and update software dependencies. Where possible, these processes have been submitted to and installed from nf-core/modules in order to make them available to all nf-core pipelines, and to everyone within the Nextflow community!
On release, automated continuous integration tests run the pipeline on a full-sized dataset on the AWS cloud infrastructure. This ensures that the pipeline runs on AWS, has sensible resource allocation defaults set to run on real-world datasets, and permits the persistent storage of results to benchmark between pipeline releases and other analysis sources. The results obtained from the full-sized test can be viewed on the nf-core website.
Pipeline summary
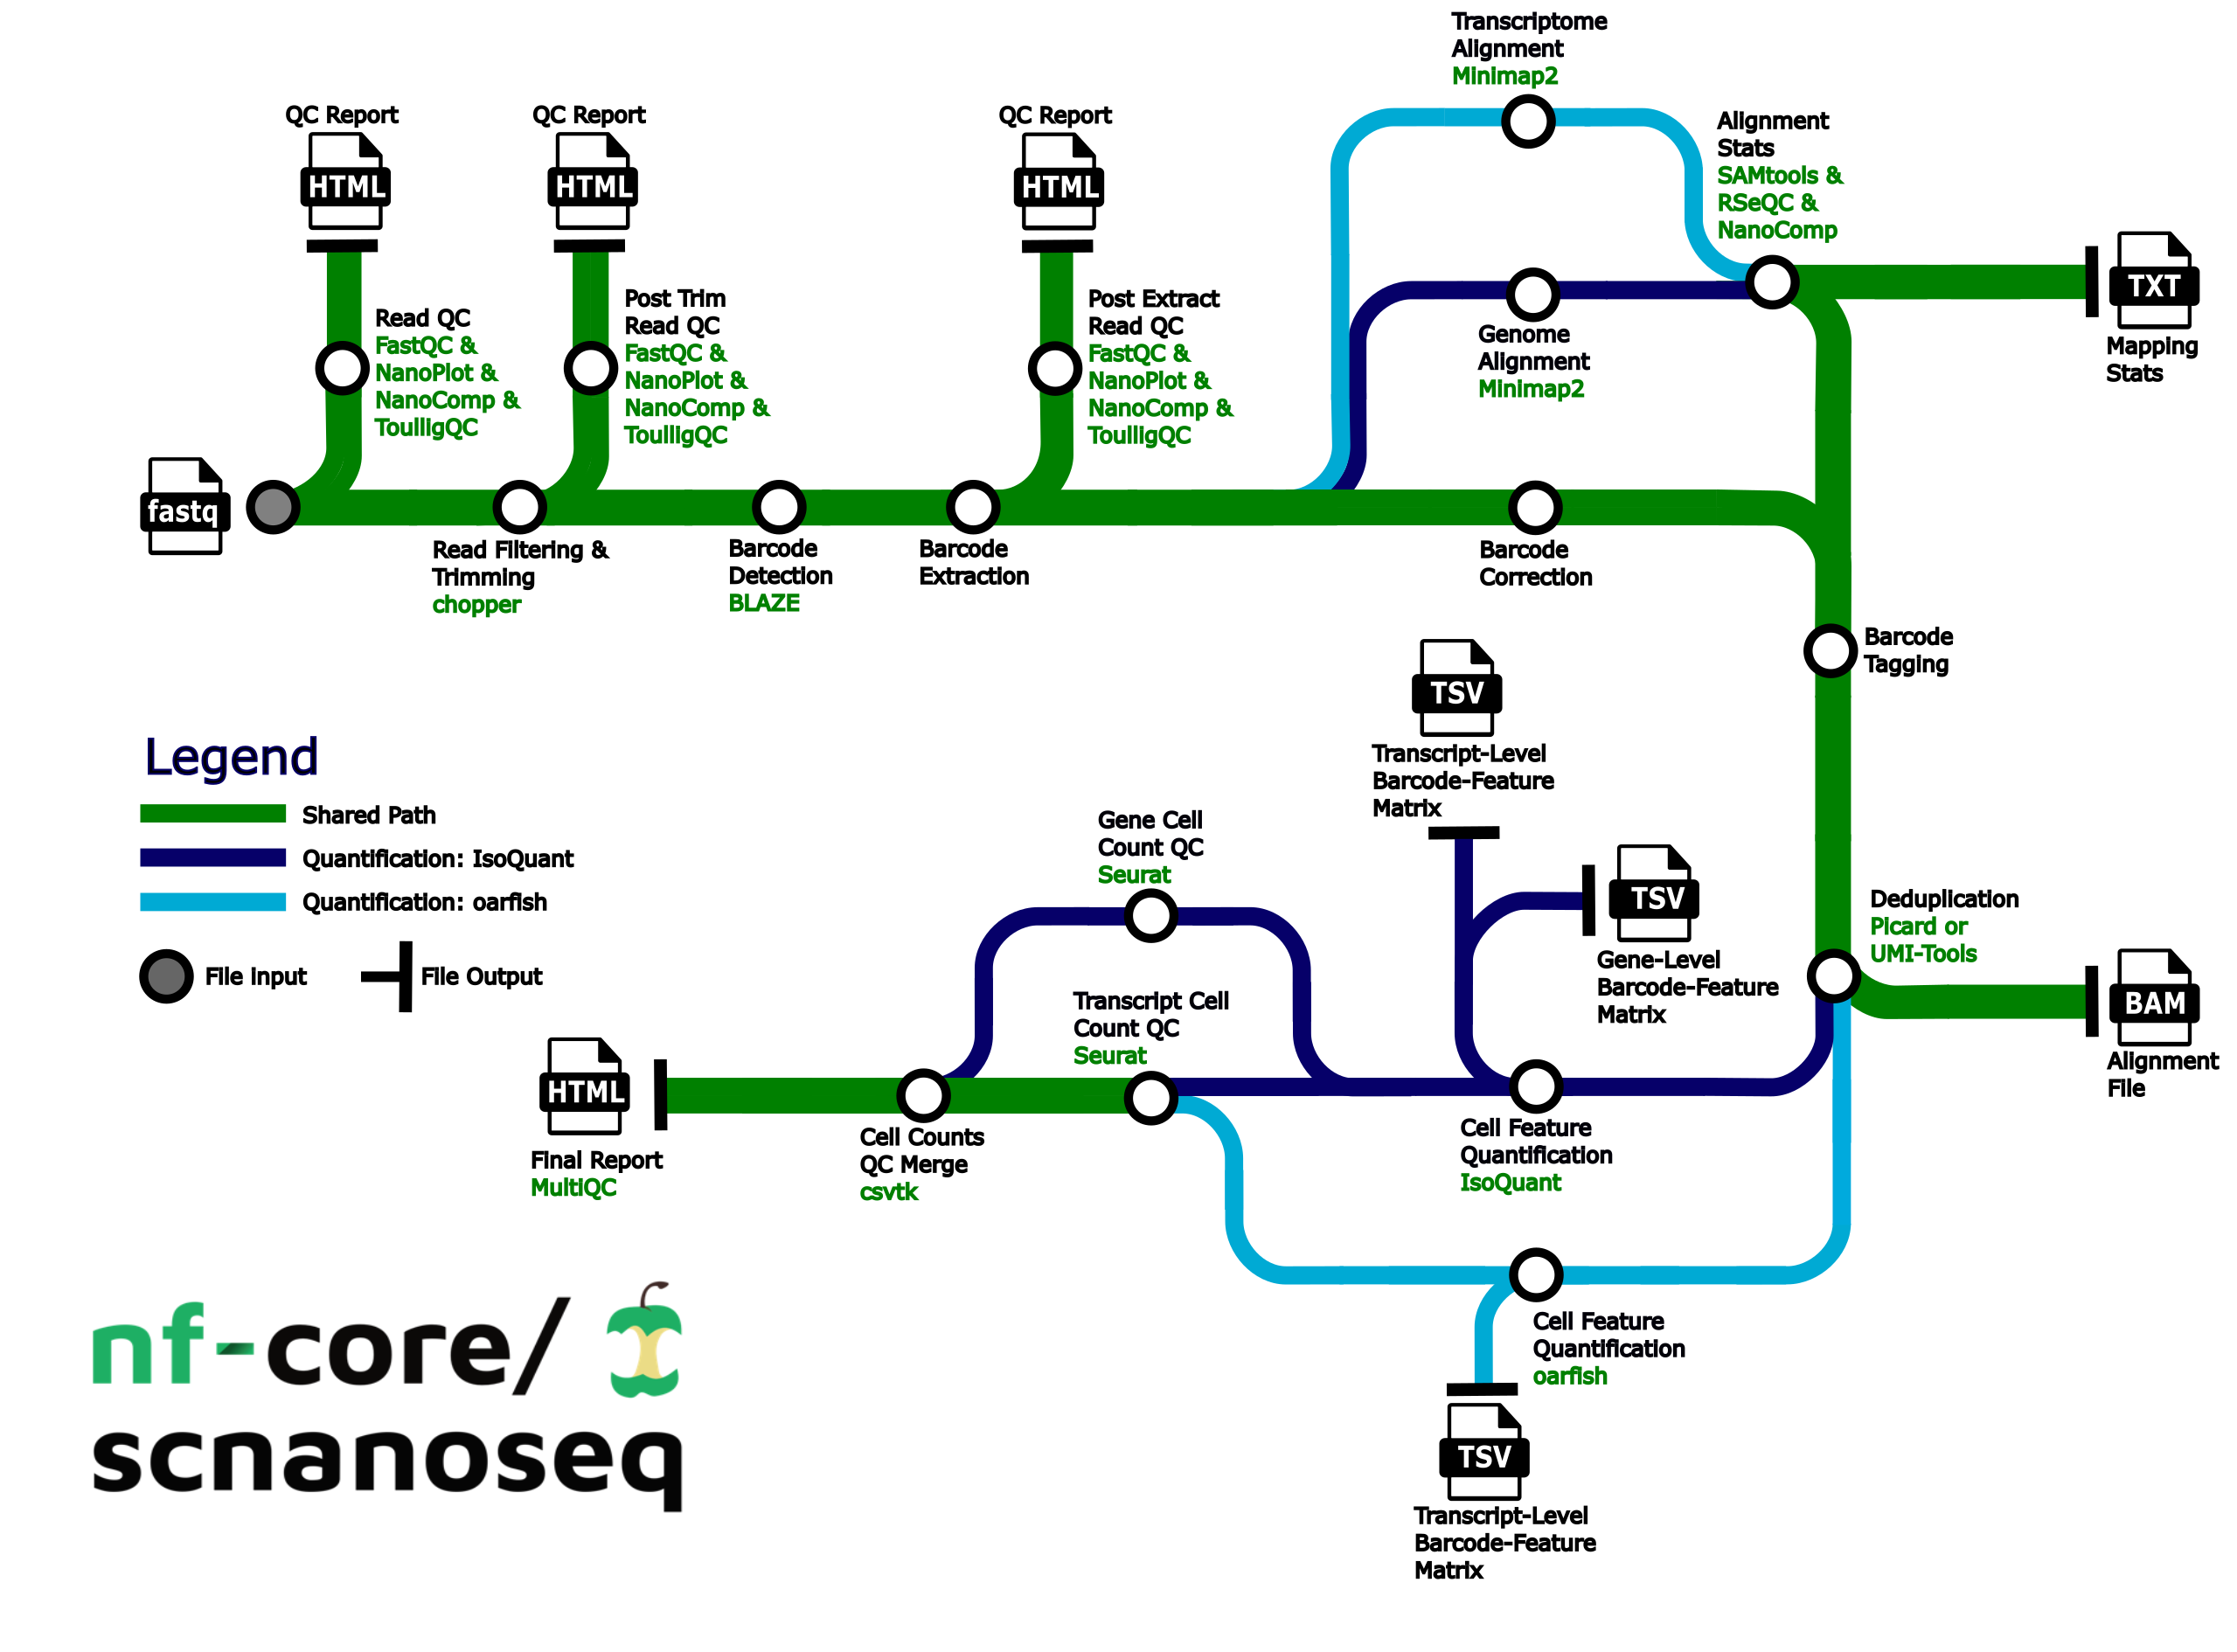
- Raw read QC (
FastQC,NanoPlot,NanoCompandToulligQC) - Unzip and split FASTQ (
pigz)- Optional: Split FASTQ for faster processing (
split)
- Optional: Split FASTQ for faster processing (
- Trim and filter reads (
Chopper) - Post trim QC (
FastQC,NanoPlot,NanoCompandToulligQC) - Barcode detection using a custom whitelist or 10X whitelist. (
BLAZE) - Extract barcodes. Consists of the following steps:
- Parse FASTQ files into R1 reads containing barcode and UMI and R2 reads containing sequencing without barcode and UMI (custom script
./bin/pre_extract_barcodes.py) - Re-zip FASTQs (
pigz)
- Parse FASTQ files into R1 reads containing barcode and UMI and R2 reads containing sequencing without barcode and UMI (custom script
- Barcode correction (custom script
./bin/correct_barcodes.py) - Post-extraction QC (
FastQC,NanoPlot,NanoCompandToulligQC) - Alignment to the genome, transcriptome, or both (
minimap2) - Post-alignment filtering of mapped reads and gathering mapping QC (
SAMtools) - Post-alignment QC in unfiltered BAM files (
NanoComp,RSeQC) - Barcode (BC) tagging with read quality, BC quality, UMI quality (custom script
./bin/tag_barcodes.py) - Read deduplication (
UMI-toolsORPicard MarkDuplicates) - Gene and transcript level matrices generation with
IsoQuantand/or transcript level matrices withoarfish - Preliminary matrix QC (
Seurat) - Compile QC for raw reads, trimmed reads, pre and post-extracted reads, mapping metrics and preliminary single-cell/nuclei QC (
MultiQC)
Usage
Note
If you are new to Nextflow and nf-core, please refer to this page on how to set-up Nextflow. Make sure to test your setup with -profile test before running the workflow on actual data.
First, prepare a samplesheet with your input data that looks as follows:
sample,fastq,cell_count
CONTROL_REP1,AEG588A1_S1.fastq.gz,5000
CONTROL_REP1,AEG588A1_S2.fastq.gz,5000
CONTROL_REP2,AEG588A2_S1.fastq.gz,5000
CONTROL_REP3,AEG588A3_S1.fastq.gz,5000
CONTROL_REP4,AEG588A4_S1.fastq.gz,5000
CONTROL_REP4,AEG588A4_S2.fastq.gz,5000
CONTROL_REP4,AEG588A4_S3.fastq.gz,5000
Each row represents a single-end fastq file. Rows with the same sample identifier are considered technical replicates and will be automatically merged. cell_count refers to the expected number of cells you expect.
nextflow run nf-core/scnanoseq \
   -profile <docker/singularity/.../institute> \
   --input samplesheet.csv \
   --outdir <OUTDIR>
Warning
Please provide pipeline parameters via the CLI or Nextflow -params-file option. Custom config files including those provided by the -c Nextflow option can be used to provide any configuration except for parameters; see docs.
For more details and further functionality, please refer to the usage documentation and the parameter documentation.
Pipeline output
This pipeline produces feature-barcode matrices as the main output. These feature-barcode matrices are able to be ingested directly by most packages used for downstream analyses such as Seurat. Additionally, the pipeline produces a number of quality control metrics to ensure that the samples processed meet expected metrics for single-cell/nuclei data.
The pipeline provides two tools to produce the aforementioned feature-barcode matrices, IsoQuant and oarfish, and the user is given the ability to choose whether to run both or just one. IsoQuant will require a genome fasta to be used as input to the pipeline, and will produce both gene and transcript level matrices. oarfish will require a transcriptome fasta to be used as input to the pipeline and will produce only transcript level matrices.
To see the results of an example test run with a full size dataset refer to the results tab on the nf-core website pipeline page. For more details about the full set of output files and reports, please refer to the output documentation.
Troubleshooting
If you experience any issues, please make sure to reach out on the #scnanoseq slack channel or open an issue on our GitHub repository. However, some resolutions for common issues will be noted below:
- Due to the nature of the data this pipeline analyzes, some tools may experience increased runtimes. For some of the custom tools made for this pipeline (
preextract_fastq.pyandcorrect_barcodes.py), we have leveraged the splitting done via thesplit_amountparameter to decrease their overall runtimes. Thesplit_amountparameter will split the input FASTQs into a number of FASTQ files, each containing a number of lines based on the value used for this parameter. As a result, it is important not to set this parameter to be too low as doing so would cause the creation of a large number of files the pipeline will be processed. While this value can be highly dependent on the data, a good starting point for an analysis would be to set this value to500000. If you find thatPREEXTRACT_FASTQandCORRECT_BARCODESare still taking long amounts of time to run, it would be worth reducing this parameter to200000or100000, but keeping the value on the order of hundred of thousands or tens of thousands should help with keeping the total number of processes minimal. An example of setting this parameter to be equal to 500000 is shown below:
split_amount: 500000
- We have seen a recurrent node failure on slurm clusters that does seem to be relat